
Ever been in the middle of a ride and wondered what, if you kept your pace, your total output would be at the end? As it turns out, it’s not that hard to figure out.
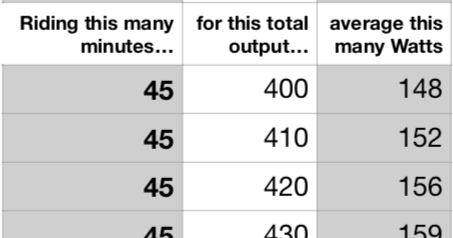
I have created a handy chart that shows what the total output would be for a ride with a given duration (in minutes) and intensity (in watts). For example: want to achieve a total output of 400 Kj in a 45 minute ride? You can, if you can average 148 watts for those 45 minutes.
This chart will work for anyone, because the conversion from watts to kj is only a function of time and is independent of body weight or other factors that need to be used for metrics such as calories burned. To the extent that your resistance is calibrated correctly, your Total Output will be correct as well.
I have found this chart to be tremendously useful (I think I look at it at least a few times every ride!) and I want to offer it to my Pelo-friends. So look below for the download link, and I hope it serves you well. If you have any suggestions for how to improve the chart, please contact me and let me know your ideas.
Happy spinning!