Among the metrics displayed on your Peloton screen is “speed”, presented in MPH with no explanation. I have been a daily Peloton rider for years, and I have always wondered how that speed is calculated. Recently, I though it would be nice to know how many watts I’d have to produce during a workout to cover a certain distance, and in order to do that I knew I would have to crack the speed code. Following is a rather lengthy examination of Peloton bike speed and a formula for calculating speed from output.
Speed is not simply how fast the wheel spins
My first thought when considering the Peloton concept of speed is that the speed of the bike should be calculable using the circumference of the flywheel multiplied by the RPMs, divided by time. It was pretty much immediately obvious that this was not correct. If it were, then resistance would have no bearing at all on speed; speed would be purely a function of cadence (a minute on the bike will be enough for you to see that it is not).

Conceptually, it’s important to understand that your Peloton bike is not simulating a fixed gear (“fixie“) bike, with resistance a substitute for hills. Looking at it, you’d be forgiven for likening the flywheel to the drive wheel on a bicycle, but that’s not the case. You can think of the flywheel as the chainring instead (even though the bike already has a chainring, er, “beltring”). The flywheel and the chainring are locked and move at the same relative speeds, so although when you look at the bike it seems logical that the flywheel is the drive wheel, if you can get your head around the idea that it’s the chainring, the rest makes sense. The flywheel is the chainring, and the resistor magnet is the rear derailleur. If that doesn’t make sense, don’t worry about it. You don’t really need to be able to conceptualize this if you will trust me that the flywheel speed is not the bike speed. So, let’s get on with it.
Speed and output are very highly correlated
Although Peloton has not shared with me the secret speed formula, my data suggests strongly that speed is a function of output alone. Basically, the harder you’re working, the faster you’re going. You can spin fast with a light resistance, or crank down on the resistance and pedal slower, but if you’re generating the same output, you’re going to be traveling at more or less the same speed.
Body weight’s role in calculating Peloton speed
It would seem that body weight, gender, resistance and cadence are not direct factors in the speed calculation. I mean, some are part of the calculation, because they factor into the output calculation, but it would seem that output is the only variable in the speed calculation.
The Data
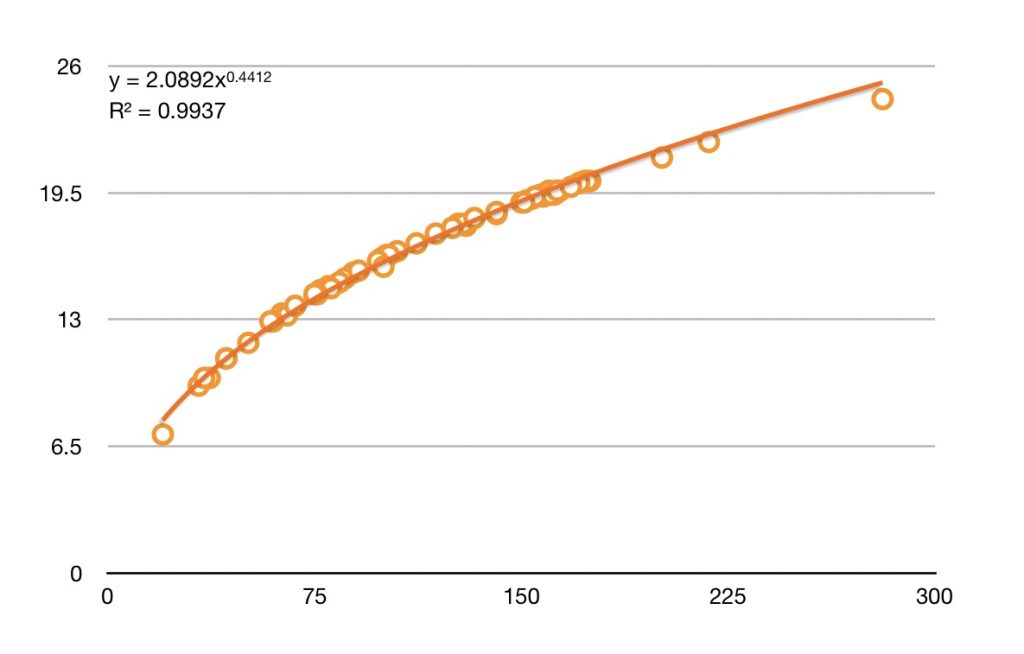
I have put together more than a hundred data points (Peloton rides) from five riders of both genders, ages between 17 and 53. Observed wattages fell in the range of 20 – 281. The R2 value of over .99 indicates that the formula very accurately describes the relationship between output and speed for all of these rides.
The Formula
Working backward from a set of data points correlating average output with average speed, the formula for finding speed is:
V = 2.1w0.44
Where V is the speed in mph and w is the output wattage (the wattage at the moment of measurement, not the total output).
This is not a prank, this is actually what my data tells me. If you think this looks needlessly complicated, I totally agree with you. That said, the data correlates very strongly with this formula (R2 > 0.99).
Almost perfect
As I mentioned above, the data fits the formula very well, so it would seem like I can wish everyone happy riding and close this post. I have to confess, though, that I’m not entirely satisfied with the equation I’ve posted above. It’s just so messy! For one thing, those are some odd number to use (I’m rounding as it is), and for another, even with an R2 value as high as it is it still seems odd to me that the data points to map even more exactly to the trend line. This is an equation with only one variable… I would expect the points to be absolutely spot on, and they’re not, and I don’t really have a good explanation as to why. Perhaps the sampling frequency plays into it. I have also noticed that the Strava data for the rides varies slightly as to total output and average speed, so the whole data collection may be a little less precise than it seems like it should be.
If and when time permits, I plan to create a handy chart mapping output and speed, similar to the Watts/kJ charts that I’ve done. Meanwhile, if you have any comments or information to share on the topic of output and speed, please share. Thanks!
7 responses to “How Your Peloton Bike Calculates Speed”
The reason I found your blog (and already commented on one of them) is because I’m interested in messing around with the Peloton numbers in more detail than their output. A little bit of googling led me here.
Anyway, you can access more fine-grained Peloton data by first uploading a class into Strava (the Peloton will do that for you if you tell it to), download the tcx file, and finally upload it into excel (I generally mess around with new types of data in excel to figure what I want out of it and the best way to get it; then, on to R for larger scale datasets and automation).
I’ve been slowly figuring out what their data mean, but one thing that is buggering me is resistance. There are several columns that give the average or max for a given metric (same number all the way down the column) including average resistance and max resistance. However, resistance is not listed for each individual time interval (the intervals are 1 to 3 seconds each; seems odd, but that’s what it is). There is a column that’s labeled as resistance, but it is the same number as the column labeled as watts. And, in fact, those are the actual average watts for that time interval.
So, your mission, should you choose to accept it, is to derive the resistance from the given data.
I would love to see that mapping for mph versus speed. Love the article and what you are doing for the animals.
Would it follow, then, that ‘Total Output’ (output x time) would map as closely to ‘Total Distance’ (speed x time)?
In my mind, because the bike is stationary, I envision resistance as essentially being the ‘gear’ the bike is in.
This seems incredibly reasonable to me.
The formula is incredibly simple, and any variation from R squared of 1 could easily be a result of rounding (either yours or the displayed metrics in the peloton).
Very nice article!
Could the reason for your offset (the points not completely accurately dropping on the line) be because of calibration differences of the bikes that your riders used?
I’m an experienced cyclist, a retired engineer, and a lover of Physics!
The information provided in this article and W.B.’s comment above suggest that the Peloton Bike emulates riding on a flat road with no wind. Spinning at a higher rate with low resistance would be like riding at a leisurely speed in a low gear on a flat road. Increasing the resistance would be like changing to a bigger gear, but still on a flat road. You are pushing harder, but at a lower cadence. So the output could be the same! As you get your cadence up, the output increases exponentially. Yeah, if I’m in top gear and going 40 mph on a flat road, I am working hard. It is worth noting that riders weight also has a negligible effect on output on a flat road.
I am a little surprised that the data obtained and graphed above shows a curve with a declining slope. I would have thought that the slope would be increasing, which would be consistent (I think) with aerodynamic drag on a real bike. Mechanical drag would probably be linear.
Also, am I correct to say that in the chart above, all data points are at the same resistance level? Would a higher resistance level produce a similar curve, but with higher “y” values?
If you want to pretend to ride on hills, you would turn the resistance way up and pedal slowly. It would feel like a hill, but the output calculation would be way off, because the elevation gain, slope, and the riders weight are not factored in.
Peloton could add another control to select a simulated slope. Then there could be a way to calculate output with the slope factored in. It would still be complicated. I am planning to buy a Peloton bike soon and have not used one. Does the tablet already allow you to do this? Seems like a simple software update with the ability to select the slope would be all they need.
Can you connect to a laptop or desktop instead of the tablet?
I took another look at the chart. If you put speed on the x axis, and output on the y axis, you do get the shape of an exponential function!